Documentation
Tile Visualization
Require: IP-Symcon >= 7.0
The Tile Visualization provides a representation of your system that visualizes the entire Object Tree or just a part of it. The visualization can be used via browser or via apps.
Connecting with the visualization
Connecting is one of the few points where apps and browsers differ:
Connecting with Apps
Connecting with Browser
Main View
The visualization represents objects from IP-Symcon as tiles and is oriented to the Object Tree. One page of the visualization thus corresponds to the content of one category. How the individual object types are displayed is described in the object-presentation
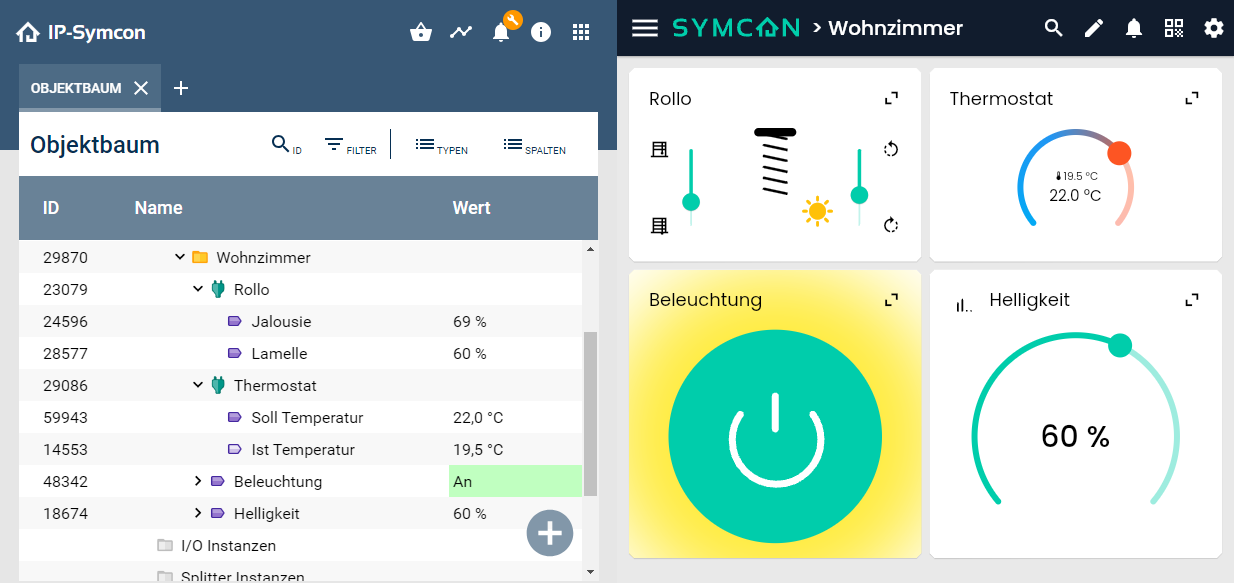
Tiles
Tiles have different display modes.
Minimized view
When tiles are displayed under a category alongside others, they use the minimized view. These are described in the object-presentation described in more detail. The size of the tile can also have an influence on the content of the tile.

Maximized view
Each tile can be maximized using the two arrows in the upper right corner. Depending on the object type and configuration, a maximized view is available. If there is none, the object itself or all child objects are displayed in a list. Even if there is an extended display, you can switch to the list display at any time by clicking the list icon in the upper right corner.
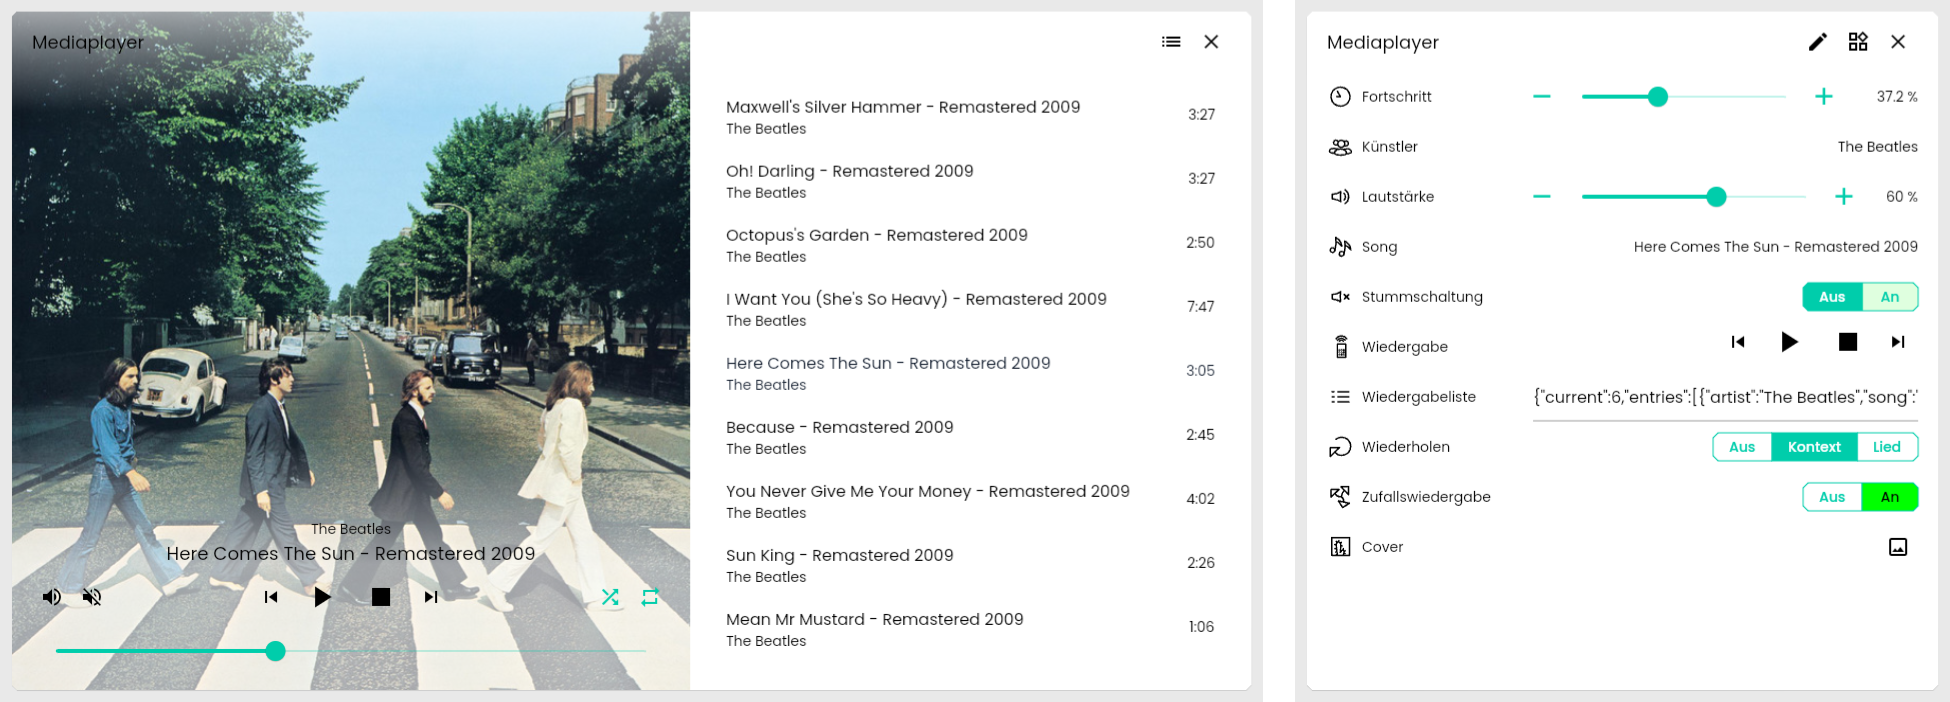
Elements of the visualization
The visualization is divided into different areas:
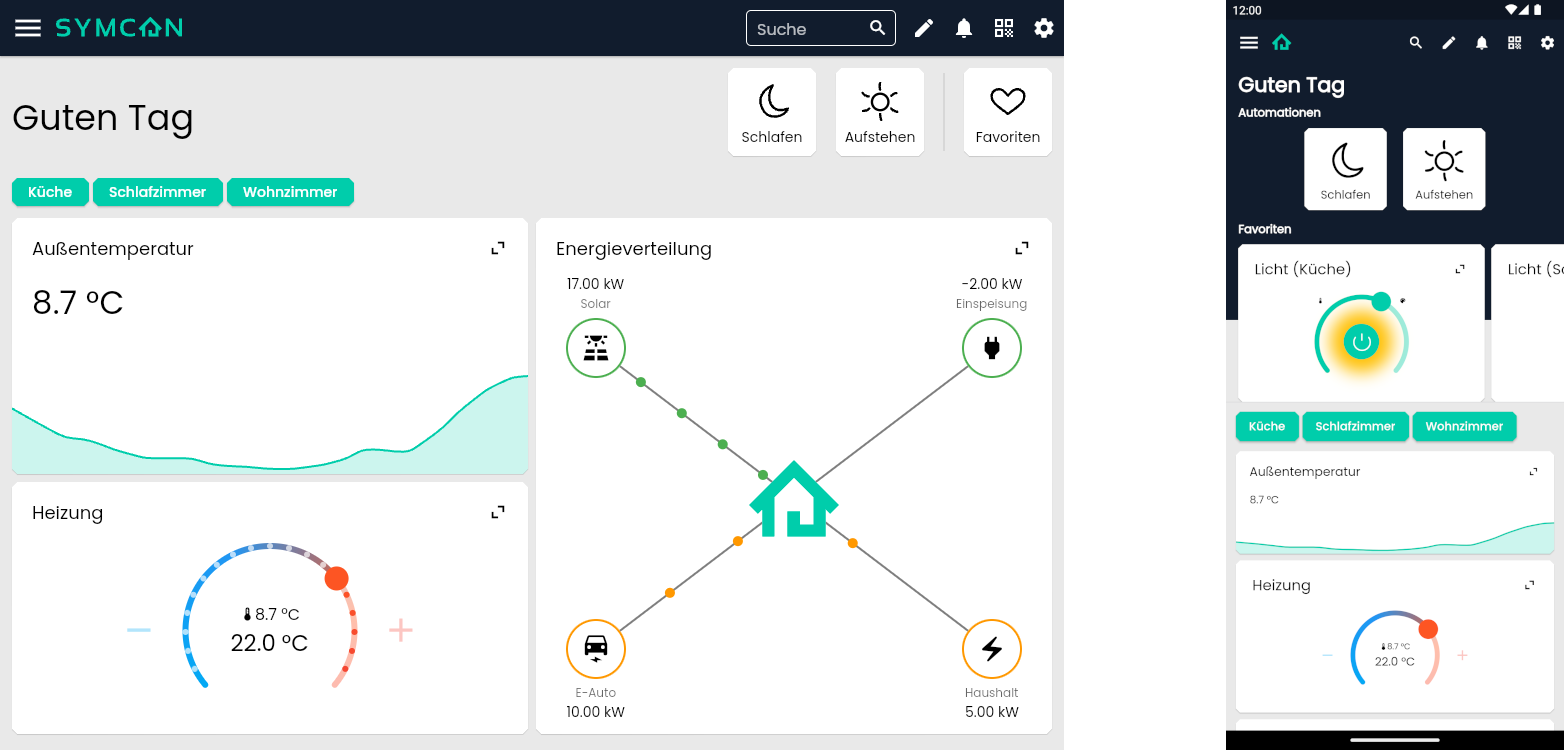
Appbar
At the top of the screen is the appbar. On the left side, an overview of the categories can be accessed via the navigation menu. On the right side is the search by default and buttons for edit mode, notifications, sharing the visualization and settings. In the instance configuration these options can be deactivated or even more presentations like the current date can be added.
Start Area
Below the appbar is the start area. The content can be changed in the instance configuration can be customized. A welcome message is displayed here by default. Additionally, a number of automations and favorites can be displayed here. For narrower screens such as smartphones, the display is slightly adjusted to make better use of the available space.
Category Bar
The category bar summarizes all categories that are in the current category. If needed, the bar wraps around to show all all of them. In the instance configuration, the category bar can be hidden, allowing categories to be displayed with the other objects below them in the object area.
Object Area
Here all objects from IP-Symcon like variables and instances are displayed as tiles. The position and size of these can be changed at any time. Likewise the content of the individual tiles can be adapted. This information is stored in display profiles for different screen sizes. More details can be found in section Individualization.
Sidebar
The sidebar can be opened via the icon in the top left corner. All categories are displayed here in a tree view and can be used for navigation. Next to the name of the visualization, a button can be used to switch between the available visualizations of the server.
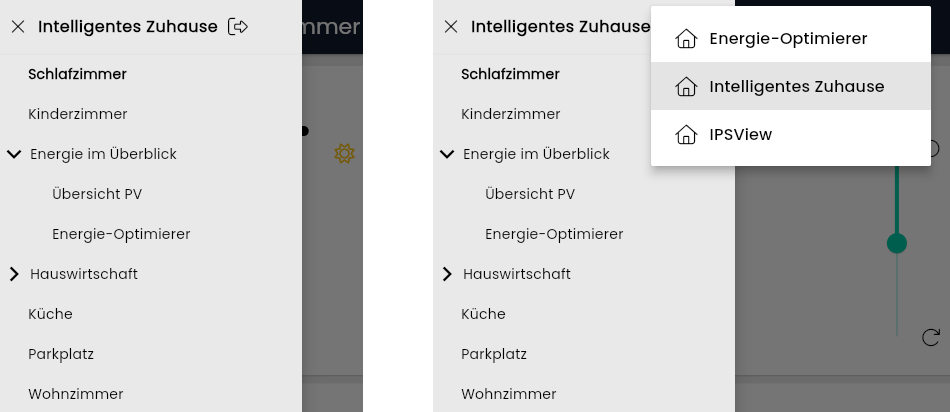
Setup
To set up the tile visualization, a tile visualization instance must exist. By default, an instance is created with the installation and is located in the object tree under "Visualization Instances".
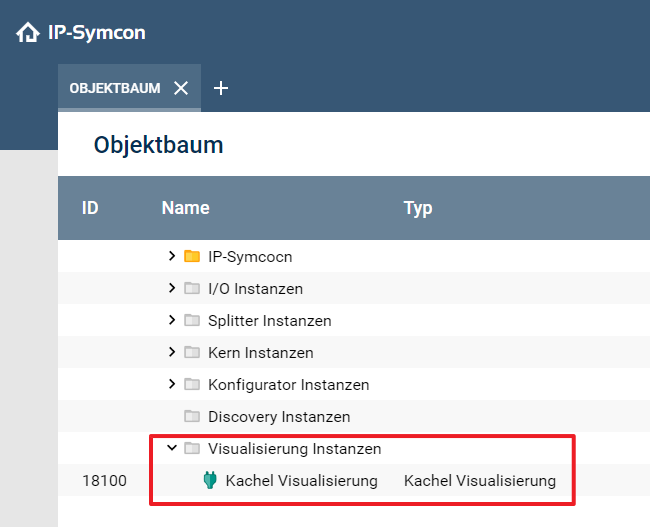
If further tile visualizations are to be set up, this can be added in the object tree via the "+" -> "Instance" -> "Tile Visualization". This creates a new tile visualization, which can be configured completely independently.
Configuration
Basically, the tile visualization runs without any further configuration. However, various settings can be made. Information about the individual settings and configuration options can be found at instance configuration. The configuration can be opened by double-clicking on the visualization tile in the object tree.
Multiple visualizations
In IP-Symcon Basic one visualization is available. In IP-Symcon Professional Edition, a total of up to five tile visualizations can be created, which can be accessed independently via the visualization start page and secured with a password if required. A visualization can be created as a stand-alone entity - for example, for a visualization object -, represent a special view for the maintenance technician, or simply create a security-specific separation. The same options are available per visualization and can be customized as desired. In the Unlimited Edition, any number of visualizations can be created.